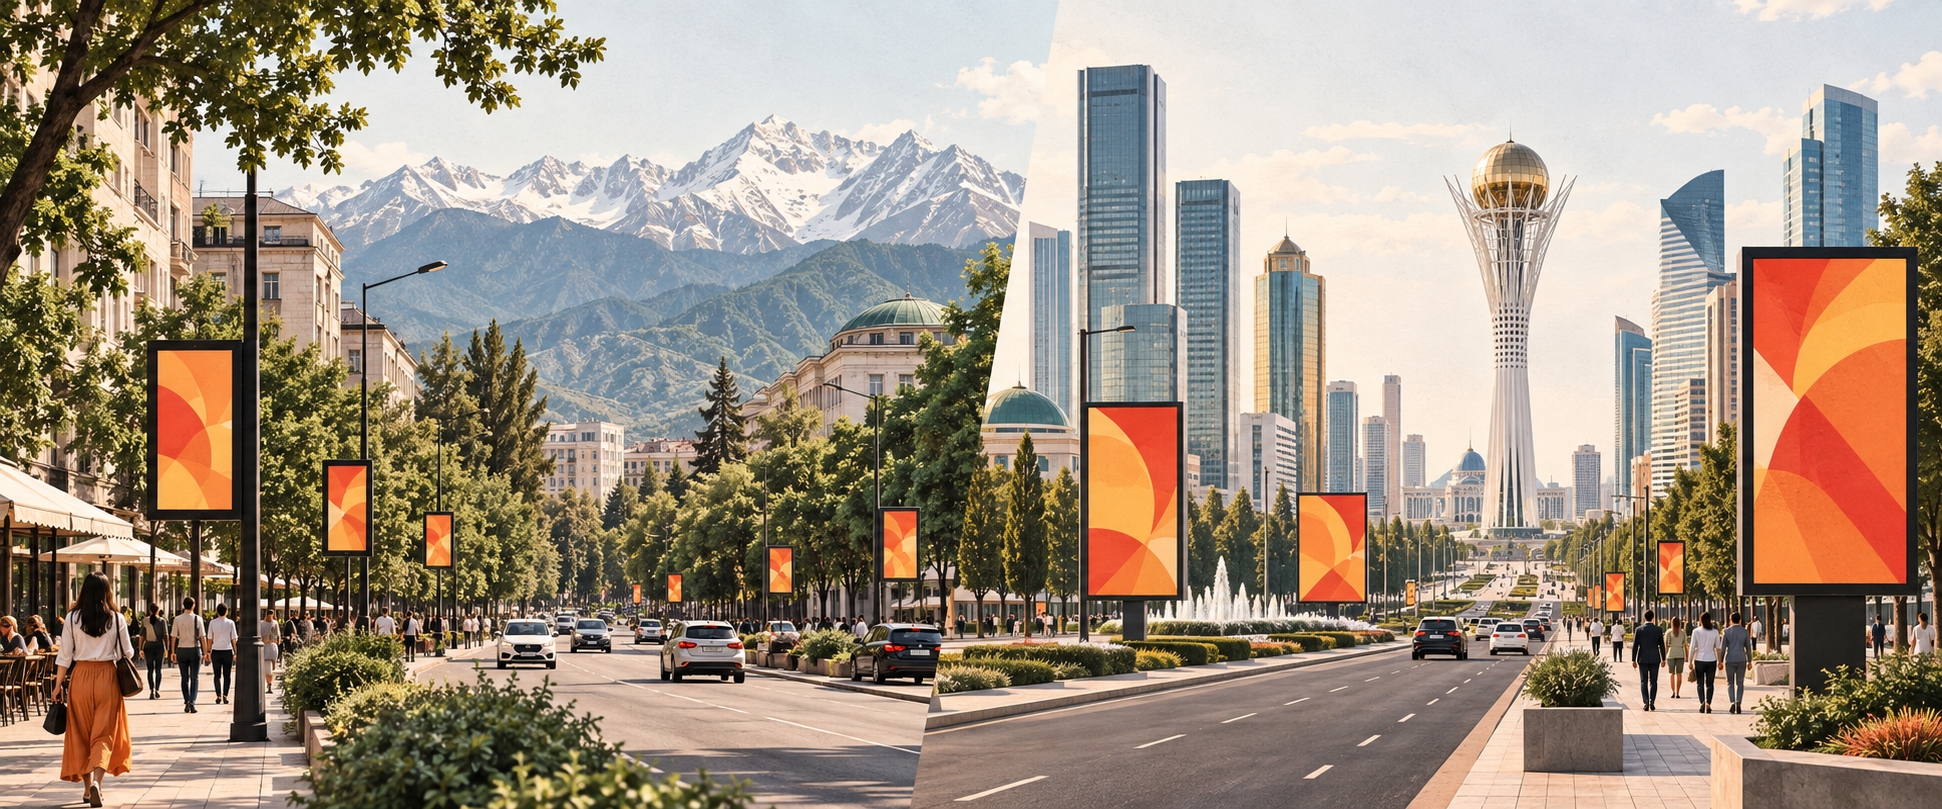
Almaty and Astana’s digital out-of-home advertising markets followed different patterns in summer 2026. Advertising activity in Almaty was spread across 587 brands, compared with 230 in Astana. The capital’s market was considerably more concentrated: its ten largest advertisers accounted for 28.3% of total share of voice (SOV), versus 21.6% in Almaty.
GEOMOTIVE analysts reached these findings by examining the share of advertising presence held by brands and product categories across DOOH in Kazakhstan’s two largest cities. Share of voice, or SOV, indicates the proportion of total advertising presence attributable to a particular brand or category.
Most advertisers in Astana also appeared in Almaty
A total of 201 brands appeared in both cities during the summer. Another 386 were observed only in Almaty and 29 only in Astana. This means that 87% of the brands observed in the capital were also seen in Almaty during the period.
These findings show that Almaty remains a broader, more fragmented advertising market. It has more advertisers, with advertising presence spread across more campaigns. Astana is more often part of the geographic footprint of advertisers already present in Almaty.
The difference also appears among the largest advertisers. Astana’s five leading brands accounted for 18.3% of SOV, compared with 13.1% in Almaty. The capital’s top twenty advertisers represented 44.5% of advertising presence, versus 33.4% in Almaty.
For advertisers, this creates different competitive environments. In Almaty, a brand needs to stand out among considerably more campaigns. Astana has fewer advertisers, but its leading players hold larger shares and exert more influence over the overall advertising landscape.
Beverages were the summer’s largest category
Beverages were the most prominent product category in both cities. They accounted for 25.7% of total SOV in Almaty—slightly more than a quarter of all advertising presence—and 17.6% in Astana. The gap between the cities was 8.1 percentage points.
Campaigns by Energia Borjomi, Flash, Pepsi, Gorilla Energy and Fuse Tea were among those contributing to the category’s high share in Almaty. Energia Borjomi ranked first among all brands in the city with a 3% share, followed by Ozon at 2.8% and Flash at 2.7%. Pepsi and Gorilla Energy each held 2.3%.
Astana had a different set of leaders. Wildberries and Adilet tied for first place, each with 3.8% SOV. Toyota held 3.7%, Ozon 3.6% and Forte 3.5%. Ozon was the only brand in the top five in both cities.
Almaty
Astana
Almaty promoted events; Astana, goods and services
Another difference concerned the types of offers being advertised. In Almaty, categories associated with city life accounted for a combined 8.6% SOV. This grouping included tourism, festivals, concerts, sport and leisure. Their combined share in Astana was 2.4%.
Almaty’s digital screens were actively used to promote events and leisure activities during the summer. Alongside advertising goods and services, the city’s outdoor media acted as a public events calendar.
In Astana, categories associated with everyday consumption and purchase decisions were prominent. Automotive, banking, marketplaces, online services and fast food together accounted for 38.7% SOV. The same group of categories held 23.4% in Almaty.
Among the main commercial segments, beverages were the only category with a noticeably higher share in Almaty. Automotive, banking, marketplaces, online services, fintech and electronics competed more strongly for advertising presence in Astana.
¹ Tourism, festivals, concerts, sport and leisure.
² Automotive, banking, marketplaces, online services and fast food.
One media plan does not guarantee equal visibility
The differences between the cities matter when planning campaigns. The same share of presence or a comparable budget does not produce identical results in two different competitive environments.
In Almaty, campaigns run alongside a large number of advertisers and substantial activity from beverage brands. Planning should therefore consider additional frequency and contexts where the brand’s message is less likely to be lost among competing offers.
In Astana, maintaining a consistent presence becomes a key consideration. Given the market’s greater concentration, even a brief reduction in activity may widen the gap with category leaders.
Campaign effectiveness should also be assessed separately for each city and product segment. An average across Almaty and Astana masks differences in advertiser numbers, category mix and the distribution of SOV among the largest players.
One launch. Two competitive landscapes.
Compare your brand’s share with its category competitors in each city. Check screen locations, actual playback and the agreed delivery volume separately.
How to read these findings
Summer data
GEOMOTIVE’s research is based on aggregated brand SOV figures for summer 2026. The data show the overall distribution of advertising presence across the full period and do not include monthly trends. Differences in totals may result from rounding.
Across the two cities, 616 unique brands were observed over the summer: 386 only in Almaty, 201 in both cities and 29 only in Astana. Approximately 87.4% of the brands observed in Astana also appeared in Almaty, rounded to 87%.
What SOV shows—and what it does not measure
Share of voice (SOV) describes the proportion of advertising presence. It is not a measure of consumer reach, attention, sales or advertiser spending. Recommendations on frequency and consistent presence are planning interpretations, not demonstrated campaign effects.